Start Excerpt.
………..
The great irony, of course, is that the lowflation lie has provided a cover for a power grab that can’t possibly be realized. That is, Keynesian central planning of the main street economy as measured by the U-3 unemployment rate and the core PCE deflator is a virtual impossibility.
That’s because in a wide-open economy deeply intertwined with global flows of goods, services, capital and cash, a national central bank—even the first among unequals—can’t effectively control either
1. the output or
2. the price side
of the main street economy. The Fed is attempting economic central planning, therefore, with flimsy financial tools—
· interest rate repression and
· bond-buying
—that are mainly good for inflating the price of financial assets, and driving a growing wedge between main street incomes and Wall Street asset valuations as they do.
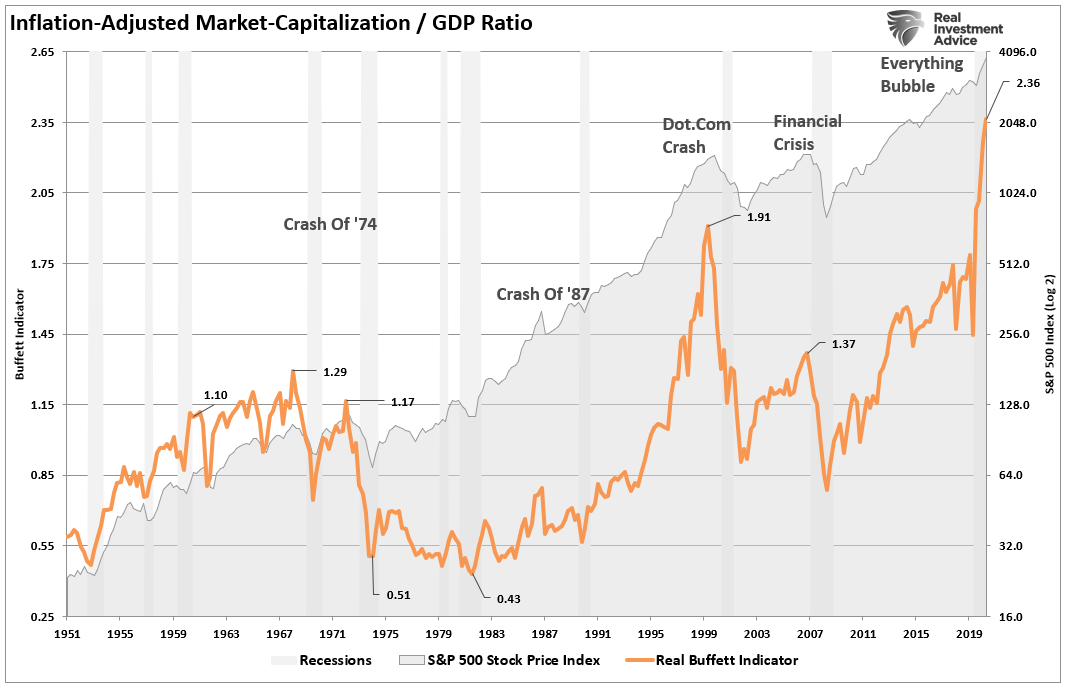
There is no better proof of that proposition than the chart below. It essentially represents the PE multiple for the entire US economy, measured as the ratio of inflation-adjusted market cap of the S&P 500 to real GDP.
Back in the heyday of American prosperity during the 1950s and 1960s that ratio oscillated between 85% and 115% of GDP. Thereafter, of course, the Fed got into the money-pumping business under Greenspan and his heirs and assigns, generating progressively higher bubble peaks and subsequent busts. But at 236% today, the so-called Buffett indicator (yellow line) is literally off the charts.
Needless to say, now that the Fed has inflated the Everything Bubble high into the nose bleed section of history, the Fed heads desperately fear a crash, and the self-evident fact that it would pound the main street economy even more savagely than occurred during the 2008-2009 Wall Street meltdown, thereby invalidating their entire Keynesian macro-management project.
So they will keep making up ploys like “2.00% inflation averaged” over time, without specifying the time period or why six years of greater than 2% CPI is not enough or why 2.00% inflation is even an appropriate target of monetary policy; and the same goes for the employment/output side, where they are also furiously inventing new measurements, such as the preposterous targeting of the employment-population ratio as we essayed in Part 1.
Fortunately, the end of this farce is near because even the clown car which is domiciled in the Eccles Building is now emitting contradictory messages and mumbles, while fools like James Bullard of the St. Louis Fed change their feathers from dove to hawk and back with such mindless frequency that even the Wall Street shills and servitors are likely to notice the growing cacophony any day now.
So the question recurs. During the 50 years nearly to the date (August 14) since Nixon’s infamy at Camp David, what has changed in the world between the 1970s environment, when the Fed first discovered it was no longer tethered to the requisites of sound money convertible into gold, and the Greenspan Era of the 1990s and thereafter, when the deliberate and massive inflation of the Fed’s balance sheet became the defining fact of economic life?
In a word, the US economy went from being the low cost supplier in the global economy to among the high cost suppliers, and from being a modest net exporter to a massive and chronic net importer.
The plain fact is that in a fiat money world when the reserve currency central bank pumps money too recklessly, you get goods and services inflation in the home economy if it cannot access lower cost imports. By contrast, when the reserve currency central bank emits a flood of fiat credit in a context in which ample lower cost imports are available, you get a massive collapse of the trade accounts, severe imported deflation and a corresponding outbreak of financial asset inflation.
This is the true dynamic of the past half century, but in tracking its evolution, it is important to recall that everything changed in [in a temporal instant during] August 1971 when Tricky Dick Nixon was persuaded by Milton Friedman to shitcan the Breton Woods system, under which exchange rates were fixed to the US dollar and the dollar was anchored to a fixed weight of gold ($35/ounce).
[But see below, after the end of this Stockman excerpt, a recent good essay of
1. what had been done to the US's proportion of World Gold between 1945 and 1971, and
2. what actually was next done after August 1971.)]
The fact that JM Keynes was one of the authors of the system cobbled together by the allies at a New Hampshire town from which the arrangement got its name was undoubtedly a major motivation for Friedman, a diminutive man who never lacked for self-confidence.
But beyond that, and more importantly, the good professor ultimately confused his love for the free market with a failure to understand that central banks not anchored to the discipline of convertibility, would ultimately generate too much free money. So he told Nixon to let markets set freely floating exchange rates, but what happened, instead, is that central bankers around the world eventually succumbed to politically driven dirty floats, driven by the unhinged production of dollar liabilities at the world so-called reserve currency central bank.
In this context, it needs be recalled that the US was a consistent net exporter of goods for the entire period between 1947 and 1970, when not a single year recorded a trade deficit. There was no special virtue about this, of course, except that it was unmistakable evidence that the US was a low cost goods producer.
Chart Omitted
Thereafter, of course, the bottom dropped out. The modest trade deficits of less than $100 billion per annum (2012$) of the 1970s became endemic, and then erupted into trillion dollar per year deficits after the turn of the century. During the quarter just ended (Q1 2021), in fact, the all-time record was posted at -$1.385 trillion at an annual rate.
The utter collapse of the tradable goods account during the last 25 years is proof positive that the US was no longer a low cost supplier of goods, and that the Fed’s pro-inflation policies were actually producing a disaster of biblical proportions.
End Excerpt.
Above
Below
Not to diminish the significance of Stockman's summary above, one may spend a half hour or so with the following pdf, recently co-authored by one of the best Economists willing to share his insights with us, Michael Hudson.
20210700 Beyond the Dollar Creditocracy, A Geopolitical Economy, Valdai Paper 116 ++.pdf
Start with this short excerpt:
One has to cut through the fog of these discourses to retrieve the real history of the dollar after 1971. Initially, it took the form of a dollar-Treasury Bill standard (Hudson 1972). As the US continued to run its current account deficits, US Treasury securities perforce became the ‘safe’ asset that foreign central banks could hold their surplus dollars in, instead of demanding gold.
However, neither it, not the other measures the US now took, could prevent the dollar’s slide.
Beyond the Dollar Creditocracy: A Geopolitical Economy Page 29
The US scuttled the Committee of Twenty negotiations to reform the international monetary system on a more equitable and less asymmetric basis when it concluded agreements with OPEC to recycle their oil surpluses in US and allied banks (Williamson 1977, xi), lifting capital controls to facilitate this...........